You are about to access:
Results are presented in 3 steps:
|
D8.1 Tool manual and guide (PDF)
|
Featured tool outputs (examples)


Choose your preferred mode
Standard modeopen access |
Expert modeopen access after submission of email address (only for project-internal monitoring) green: additional features in expert mode |
|
| Impacts covered | 8 (pre-aggregated from expert mode)
Note: some cannot be aggregated and are excluded in standard mode |
32 disaggregated impacts |
| Physical impacts | Select only 1 (pre-aggregated) impact (aggregation of different units not possible) | Select only 1 (disaggregated) impact (aggregation of different units not possible)
Display effect as total or levelised by national GDP or population (2015 values) |
| Monetized impacts | Select any number of (monetised) pre-aggregated impacts | Select any number of (monetised) disaggregated impacts
Display effect as total or levelised by national GDP or population (2015 values) Sensitivity analysis: energy prices (+/- 10% for energy cost savings) |
| Cost-Benefit Analysis (CBA) | Indicators available:
For annualised values:
|
Indicators available:
For values:
Levelisation
Sensitivity analysis
|
Impact overview in expert and standard mode
More details: see D2.4 synthesis report
| Impact category | Impact no | Multiple Impacts (expert mode) | physical unit | monetisation | incl. in standard mode | incl. in CBA |
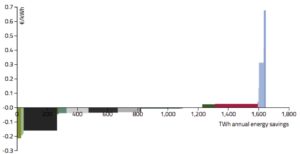
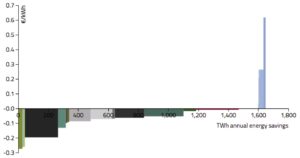
| Energy | 0 |
Energy savings | TWh | √ | √ | √ |
| Air pollution | 1 |
NOx | kt | |||
| 2 |
PM10 | kt | ||||
| 3 |
PM2.5 | kt | ||||
| 4 |
SO2 | kt | ||||
| 5 |
VOC | kt | ||||
| Ecosystem degradation | 6 |
Acidification | km2 (change in area affected by excess acidification) | √ (6+7) | ||
| 7 |
Eutrophication | km2 (% change in area affected by eutrophication) | √ (6+7) | |||
| Energy system/
security |
8 |
Avoided electric power output & investment costs | TWh | √ | √ | √ |
| 9 |
De-rated reserve capacity rate | Share (%) | ||||
| 10 |
Energy intensity | kgoe/1000€ GDP | ||||
| 11 |
Energy security index
Herfindahl-Hirschman index (including independency, political stability and diversity) |
% (change in COMBI energy security index)
|
||||
| 12 |
Fossil Fuel imports | % (share of fossil fuel imports from outside EU28 in primary energy supply) | √ | |||
| Labour productivity | 13 |
Active days gained
(from indoor exposure-related diseases and time saved by avoiding traffic congestion) |
mn workdays | √ | √ (13+14+15) | √ |
| 14 |
Reduced congestion
(avoided time loss in traffic) |
mn workdays | √ | √ (13+14+15) | ||
| 15 |
Workforce performance
(Commercial labour productivity due to improved indoor conditions after tertiary sector building refurbishment) |
mn workdays | √ | √ (13+14+15) | ||
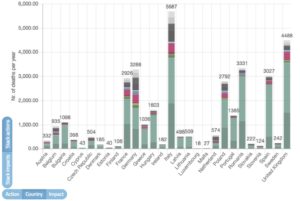
| Mortality | 16 |
Excess winter mortality | Nr. of deaths per year | √ | √ (16+17+18) | √ (16+17+18) |
| 17 |
Mortality ozone | Nr. of deaths per year | √ | √ (16+17+18) | √ (16+17+18) | |
| 18 |
Mortality PM2.5 | Nr. of deaths per year | √ | √ (16+17+18) | √ (16+17+18) | |
| Climate | 19 |
Carbon footprint | Mt CO2eq | |||
| 20 |
direct GHG emissions | Mt CO2eq | √ | √ | √ | |
| Health/morbidity | 21 |
Indoor air pollution | 1000 DALYs | √ | √ (21+22+23) | √ (21+22+23) |
| 22 |
Winter morbidity (asthma) | 1000 DALYs | √ | √ (21+22+23) | √ (21+22+23) | |
| 23 |
YOLL PM2.5 | 1000 YOLL | √ | √ (21+22+23) | √ (21+22+23) | |
| Macro-economy | 24 |
Employment (max) | 1000 person-years | |||
| 25 |
GDP (max) | bn € | √ | √ | ||
| 26 |
Public budget (max) | bn € | √ | |||
| Resources/ material footprint | 27 |
Biotic materials | Mt | √ (27 to 31) | ||
| 28 |
Fossil fuels | Mt | √ | √ (27 to 31) | ||
| 29 |
Metal ores | Mt | √ | √ (27 to 31) | ||
| 30 |
Minerals | Mt | √ (27 to 31) | |||
| 31 |
Unused extraction | Mt | √ (27 to 31) |